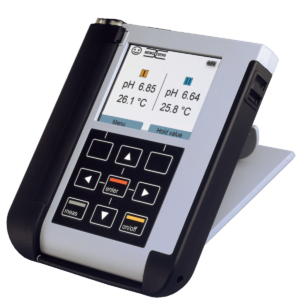
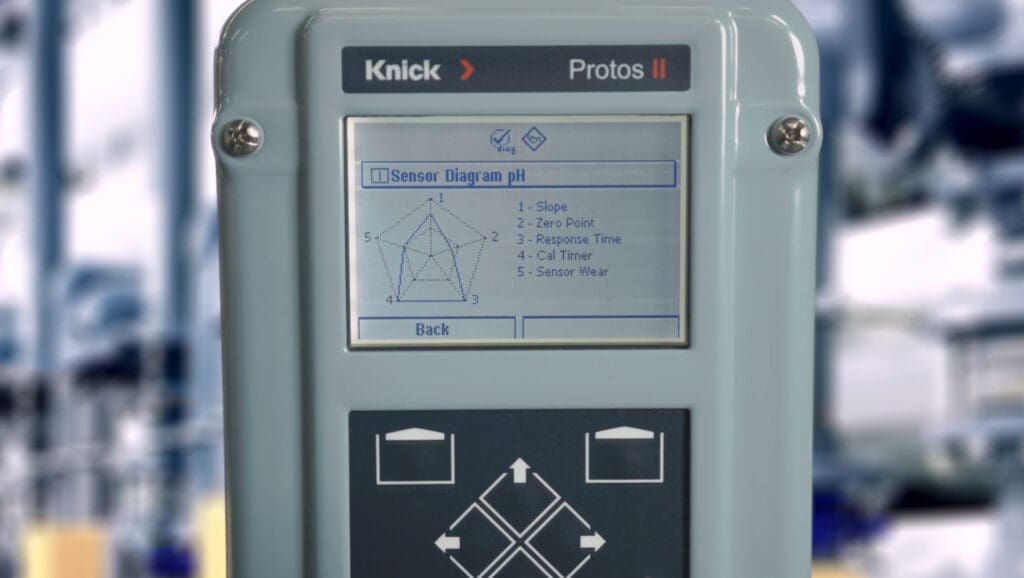
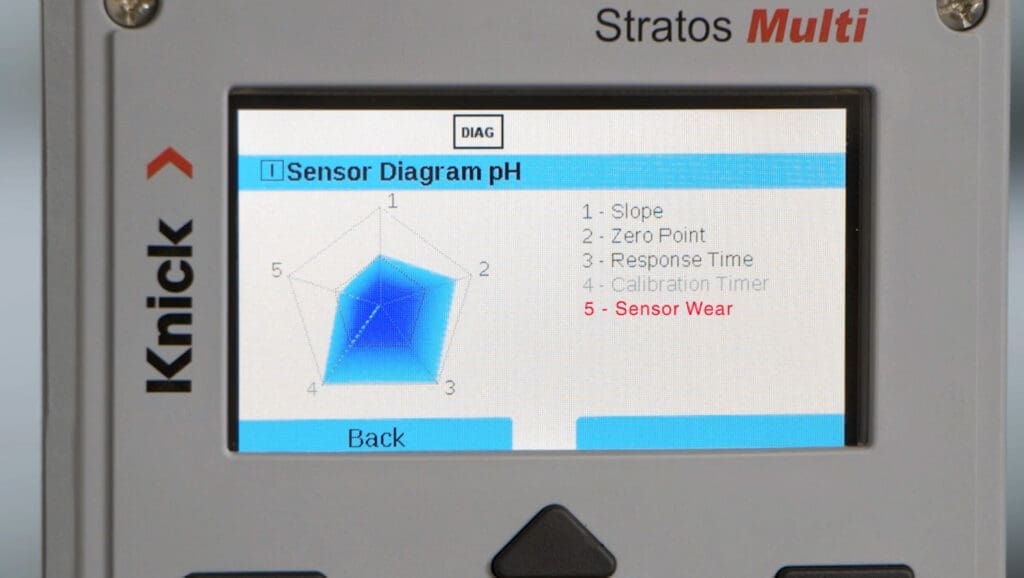
For a quick analysis of the condition of your connected sensor, you can use the Sensor Diagram when troubleshooting pH, ORP, and oxygen sensors. The pH Sensor Diagram is a unique feature of the Stratos Multi and Protos transmitters and Portavo 907 & 908 portable meters. The diagram provides single-glance information on continuously monitored sensor parameters. The parameter values in the diagram should lie between the outer 100% and inner 50%. When a value enters the inner portion of  the diagram, the corresponding caption text flashes red, and the sensor needs attendance. Cleaning and calibrating the sensor may remedy the situation, or the sensor may need a replacement. The values attached to these diagnostics are concurrent among all Memosens pH sensors regardless of manufacturer. Only the Knick Stratos Multi, Protos, and Portavo 907 & 908 Transmitters have the capability of pulling this diagnostic data in an intuitive graph.
These values are helpful tools that can determine if your sensor needs to be cleaned, calibrated, put back into service, or replaced. Below are a few steps to consider when acknowledging a parameter value that has begun to dip. If followed properly, these tips will help to ensure a healthy and reliable measurement loop, along with getting the most life out of your sensor.
Slope
In the pH sensor diagram, the slope indicates the mV potential from one pH unit to the next. An environment or substance with a neutral pH of 7 should always read as 59.16mv at 25°C. At this value, the slope will be 100%. The slope value should ideally stay within 80-100% when adjusted during calibration. Operators should clean and calibrate their sensors if slope values consistently fall around 90%. If you notice the slope consistently falling below 80%, you will likely need to replace the sensor.
Zero Point
 Accurate calibrations are essential to a stable zero point. Shifts in the sensor’s zero point tend to indicate contamination of the sensor’s reference system. A thorough cleaning and re-calibration of the sensor can help realign the zero point to its ideal reading of +/-30 mv. It is natural for this value to drift over time. Depending on the process, the rate of drift can fluctuate. However, if the zero point falls consistently outside of the ideal reading, it’s likely the sensor has been contaminated and will need to be replaced.
Response Time
Sensor response time is an indication of reaching a stable measured value. The transmitter captures response time during the calibration process. An ideal response time for a new Memosens pH sensor is less than 30 seconds. As the sensor ages, response time may increase. Thorough cleaning, rehydration, and calibration can decrease response time. If response time increases after cleaning and calibration, the sensor likely needs to be replaced.
Cal Timer
This feature is an optional, customizable diagnostic that dependent on user preference. The operator can input a calibration preference and schedule calibrations at regular intervals. However, for a process that requires long-lasting function from the sensor, it is recommended Cal Timer be kept off so as not to interrupt the process. Once a calibration interval is determined, the sensor will stop functioning until it is calibrated at that interval. For processes needing frequent calibrations, Cal Timer in the pH Sensor Diagram is a unique sensor diagram tool that helps operators stay on schedule.
Sensor Wear
 This diagnostic is the most prominent indicator of when a sensor may need to be replaced. Sensor wear is represented by a weighted calculated value of 0-100%. This is determined by the loads the sensor has been exposed to. For instance, extreme process conditions like high temperatures and corrosive process media will generate faster wear. This value provides crucial insight into the sensor’s condition and allows operators to prepare for the replacement time. If depletion persists following cleaning and calibration, it is likely the sensor needs to be replaced. Implementing automated retractable housing/cleaning systems can also increase sensor lifetime.
Sensocheck/Glass Impedance
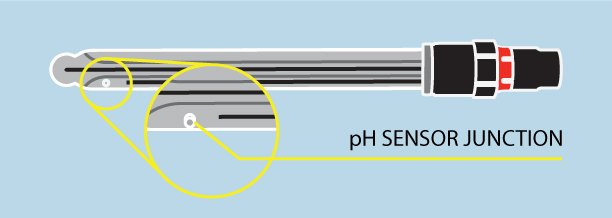
This value on the sensor diagram monitors the impedance between the measurement and reference electrodes. Impedance is a dynamic value that is continuously changing. A sensor in a highly acidic or basic process can deteriorate the sensor membrane. Additionally, this value can indicate a broken sensor which would read as 0 impedance. It can also be a sign of buildup accumulating on the sensor membrane. Dehydration of the membrane can also affect impedance. It is vital to place sensors in the process properly. Misalignment from the process media also affects impedance. Membrane hydration is another factor that affects impedance. Be sure to properly store your sensor in its hydrating wetting cap filled with KCl (potassium chloride) solution.
Know Your Sensor and use the pH Sensor Diagram
Maintaining liquid analytical sensors is key to consistency and accuracy. The sensor diagram feature of the Knick Stratos Multi and Protos transmitters, as well as the Portavo 907 & 908, help operators determine what aspect of instrumentation needs attention. Check out some of our helpful videos on troubleshooting available diagnostics information.